1Introduction
1.1Background
1.1.1 This Operational Noise Technical Report presents details of the assessment of operational noise impacts on Noise Sensitive Receptors (NSRs) for the onshore elements of the Ayre Offshore Wind Farm (the ‘Project’). For ease of reference the onshore elements of the Project, landward of Mean Low Water Springs (MLWS), are referred to as the ‘Proposed Development’.
1.1.2 The Proposed Development will include Landfall at Sinclair’s Bay, Caithness, an Onshore Export Cable Corridor, a new Substation, and a 400 kV Cable Corridor for onward transmission connecting the new Substation to Banniskirk Hub. The Substation is the only operational noise source that may impact the amenity of nearby receptors and is the focus of this report. Within the Substation there would be the Substation Switchyard, which would represent the operational component of the Substation.
1.1.3 The Onshore Environmental Impact Assessment (EIA) Report accompanies the application to The Highland Council (THC) for Planning Permission in Principle (PPP) for the Proposed Development.
1.2Report Aims
1.2.1 The report aims to considers the assessment of noise impacts on nearby NSR within the Operational Noise Study Area due to the operational noise sources associated with the Proposed Development. These sources include the electrical components forming the plant strategy for the Substation.
1.3Consultation
1.3.1 The overall approach to consultation for the Proposed Development is set out in Volume 1, Chapter 4: EIA Methodology. A summary of the issues raised during consultation activities regarding Operational Noise from the Substation are presented in Table 1.1 Open ▸ , together with details of the responses received.
2Operational Noise Study Area
2.1.1 In terms of the Proposed Development the Substation Switchyard is the only operational noise source that may impact the amenity of nearby NSR. With respect to the Substation Switchyard, therefore, the Operational Noise Study Area is shown in Figure 2.1 Open ▸ and defined as follows:
- noise sensitive receptors located within 500 m of the operational noise sources, represented by the Substation Switchyard.
2.1.2 The assessment of operational noise impacts has been undertaken at the NSR most likely to be affected by noise during the operation phase of the Proposed Development. These have been identified as being situated within a study area of 500 m from the location of the operational noise sources associated with the Proposed Development at the Substation Switchyard in line with the methodology proposed at scoping and the received scoping opinion from THC.
Figure 2.1: Operational Noise Study Area
3Methodology
3.1.1 Operational noise levels due to the Proposed Development have been calculated at representative NSRs within the Operational Noise Study Area via 3D acoustic modelling. Subsequently, the predicted levels have been assessed with reference to the guidance in BS 4142:2014+A1:2019 – ‘Methods for rating and assessing industrial and commercial sound’.
3.1.2 The closest noise sensitive receptors are listed in Table 3.1 Open ▸ and are also shown on Figure 2.1 Open ▸ .
British Standard 4142:2014+A1:2019
3.1.3 This guidance provides a method for rating industrial and commercial sound and a method for assessing resulting impacts upon people. The method is applicable to fixed plant installations, sound from industrial and manufacturing process and other associated activities.
3.1.4 In summary, this Standard provides guidance on determining ‘rating sound levels’ by correcting the ‘specific sound level’ from the site or operations under consideration to account for any distinctive acoustic characteristics such as tonality, impulsivity, and intermittency. The Standard provides the following corrections to be applied where each is appropriate:
- ‘Tonality - For sound ranging from not tonal to prominently tonal the Joint Nordic Method gives a correction of between 0 dB and +6 dB for tonality. Subjectively, this can be converted to a penalty of 2 dB for a tone which is just perceptible at the noise receptor, 4 dB where it is clearly perceptible, and 6 dB where it is highly perceptible.
- Impulsivity - A correction of up to +9 dB can be applied for sound that is highly impulsive, considering both the rapidity of the change in sound level and the overall change in sound level. Subjectively, this can be converted to a penalty of 3 dB for impulsivity which is just perceptible at the noise receptor, 6 dB where it is clearly perceptible, and 9 dB where it is highly perceptible.
- Intermittency - When the specific sound has identifiable on/off conditions, the specific sound level should be representative of the time period of length equal to the reference time interval which contains the greatest total amount of on time. … If the intermittency is readily distinctive against the residual acoustic environment, a penalty of 3 dB can be applied.
- Other sound characteristics - Where the specific sound features characteristics that are neither tonal nor impulsive, nor intermittent, though otherwise are readily distinctive against the residual acoustic environment, a penalty of 3 dB can be applied.’
3.1.5 Background sound levels at the receptors were identified from baseline sound surveys undertaken in October 2024 (see Volume 2, Appendix 13.1: Baseline Sound Survey). An initial estimate of the impact of the source is obtained by subtracting the measured background sound level from the rating sound level of the proposed plant.
3.1.6 The representative background sound levels at each receptor are presented in Volume 1, Chapter 13: Noise and Vibration of the Onshore EIA Report. The representative background sound levels have been derived via statistical analysis of the measured LA90,T levels during the day and night-time periods, respectively. Note 1 of paragraph 8.1.4 of BS 4142:2014+A1:2019 states the following regarding the derivation of a representative background sound level:
‘A representative level should account for the range of background sound levels and should not automatically be assumed to be either the minimum or modal value.’
3.1.7 As such, histograms of the cumulative frequency of occurrence have been plotted to show the most frequently occurring background sound levels during each period and compared with the time-history graphs.
3.1.8 Typically, the greater the difference between the measured background sound level and the rating sound level, the greater the magnitude of the impact. The operational noise criteria adopted for the Proposed Development are presented in Table 3.2 Open ▸ .
3.1.9 As noted in Table 3.2 Open ▸ , the magnitude impact as assessed by BS4142 is dependent upon context and therefore contains a qualitative element. The Scottish Government’s Technical Advice Note (TAN) on the Assessment of Noise provides guidance on qualitative assessment, as presented in Table 3.3 Open ▸ .
3.1.10 All nearby noise sensitive receptors are residential and are thus considered to be of high sensitivity both during the daytime and night-time, as described in Table 13.9 in Volume 1, Chapter 13: Noise and Vibration.
3.1.11 This appendix presents the quantitative impacts resulting from the assessment. A contextual assessment of the likely impacts has been undertaken in Volume 1, Chapter 13: Noise and vibration of the Onshore EIA Report as part of the assessment of significant effects.
3.2Acoustic Modelling Methodology
3.2.1 A 3D acoustic model has been constructed using the SoundPLAN v9.1 software package. This software implements the outdoor sound propagation method detailed within ISO 9613-2:2024: ‘Acoustics – Attenuation of sound during propagation outdoors – Part 2: Engineering method for the prediction of sound pressure levels outdoors’. Sound levels have been predicted under light down-wind conditions based on hemispherical radiation with corrections added for atmospheric absorption, ground effects, screening, and source directivity, where each is appropriate. This standard is widely accepted as the industry-standard model.
3.2.2 The maximum design scenario is outlined in Table 13.7 of Volume 1, Chapter 13: Noise and Vibration. The list of proposed plant items and maximum quantities is presented in Table 3.4 Open ▸ .
3.2.3 The input parameters relevant to the Substation model include the information outlined in the Paragraphs 3.2.4 to 3.2.23.
Local topographical features
3.2.5 The receptors and other buildings which may provide screening effects have been obtained by importing OS Mastermap Topography and satellite imagery layers for the Substation Switchyard area.
3.2.6 A digital ground model has been calculated using detailed OS Terrain 5 data for Substation area. The proposed topography for the Substation Switchyard has also been included in the digital ground model to account for the future ground conditions.
Ground effects
3.2.7 Sound propagating outdoors comprises direct waves travelling straight from source to receiver and reflected waves which interact with the ground. Harder surfaces reflect more sound thereby resulting in enhanced noise levels at the receptor. Softer surfaces such as grass, trees, or vegetation have a higher porosity and thus can absorb reflected waves resulting in lower noise levels at the receptor.
3.2.8 The acoustic properties of the ground are accounted for using the ground factor G which is a dimensionless parameter between 0 and 1. ISO 9613-2:1996 specifies a ground factor of 0 for hard surfaces and 1 for porous surfaces.
3.2.9 The area surrounding the Substation area is predominantly grassland and woodland and thus has been assigned a ground factor of G = 0.7.
3.2.10 The Substation Switchyard is assumed to comprise hard ground with a ground factor of G = 0.
Plant strategy and layout
3.2.11 The maximum design scenario is represented by all plant operating continuously at maximum operational duty 24/7. The primary model input is the source noise levels of the proposed plant strategy and the operating conditions for the Substation Switchyard.
3.2.12 The maximum design scenario is represented by a 220 kV Gas Insulated Switchgear Substation. The location of each plant item has been obtained from an indicative engineering layout for the Substation Switchyard as presented in Plate 3.1 Open ▸ .
3.2.13 The frequency content of the noise emission spectra have been obtained from operational noise assessments for similar schemes (such as East Anglia ONE (North), Sheringham Shoal Extension and Dudgeon Extension). The full spectra are presented in Annex A.
3.2.14 The proposed plant has been modelled in two ways:
- Industrial buildings: The industrial building feature in SoundPLAN allows for any larger plant items to be modelled as boxes with all outside surfaces radiating with an assigned sound power level. The sound power level per façade has been calculated by distributing the total sound power level over each individual face of the plant item based upon the area.
- Point sources: Smaller plant items have been modelled as point sources which radiate in such a way that the sound attenuates proportionally with the square of the inverse of the distance from the source.
3.2.15 Table 3.4 Open ▸ presents the plant strategy used in the modelling of the Substation and includes a Source ID to identify plant locations on Plate 3.1 Open ▸ this list is based on the indicative Substation layout.
3.2.16 Additional notes on the assumptions adopted for the Substation plant noise emission levels are as follows:
- There are four locations shown on the indicative Substation layout for harmonic filters (two each for P1 and P6). Each of these spaces is assumed to contain three filter phases. The provided sound power level is LW 91 dB(A) for the 400 kV filters (P1) and LW 86 dB(A) for the 220 kV filters (P6). It has been assumed that these are the sound power levels per phase and thus each filter is modelled using three point sources, each with a sound power level of LW 91 dB(A) for P1 or LW 86 dB(A) for P6.
- There are five banks of Control Building Heating, Ventilation and Air Conditioning Units, with a provided sound power level of LW 80 dB(A). Each bank is comprised of six fans, each of which has been modelled with a single point source of sound power level LW 80 dB(A). The exact location of these banks is not shown on the indicative Substation layout, so they are assumed to be installed at ground level close to the relevant control building.
- Cooling plant for each of the Statcom Transformers has been modelled as an additional point source sound power level LW 86 dB(A).
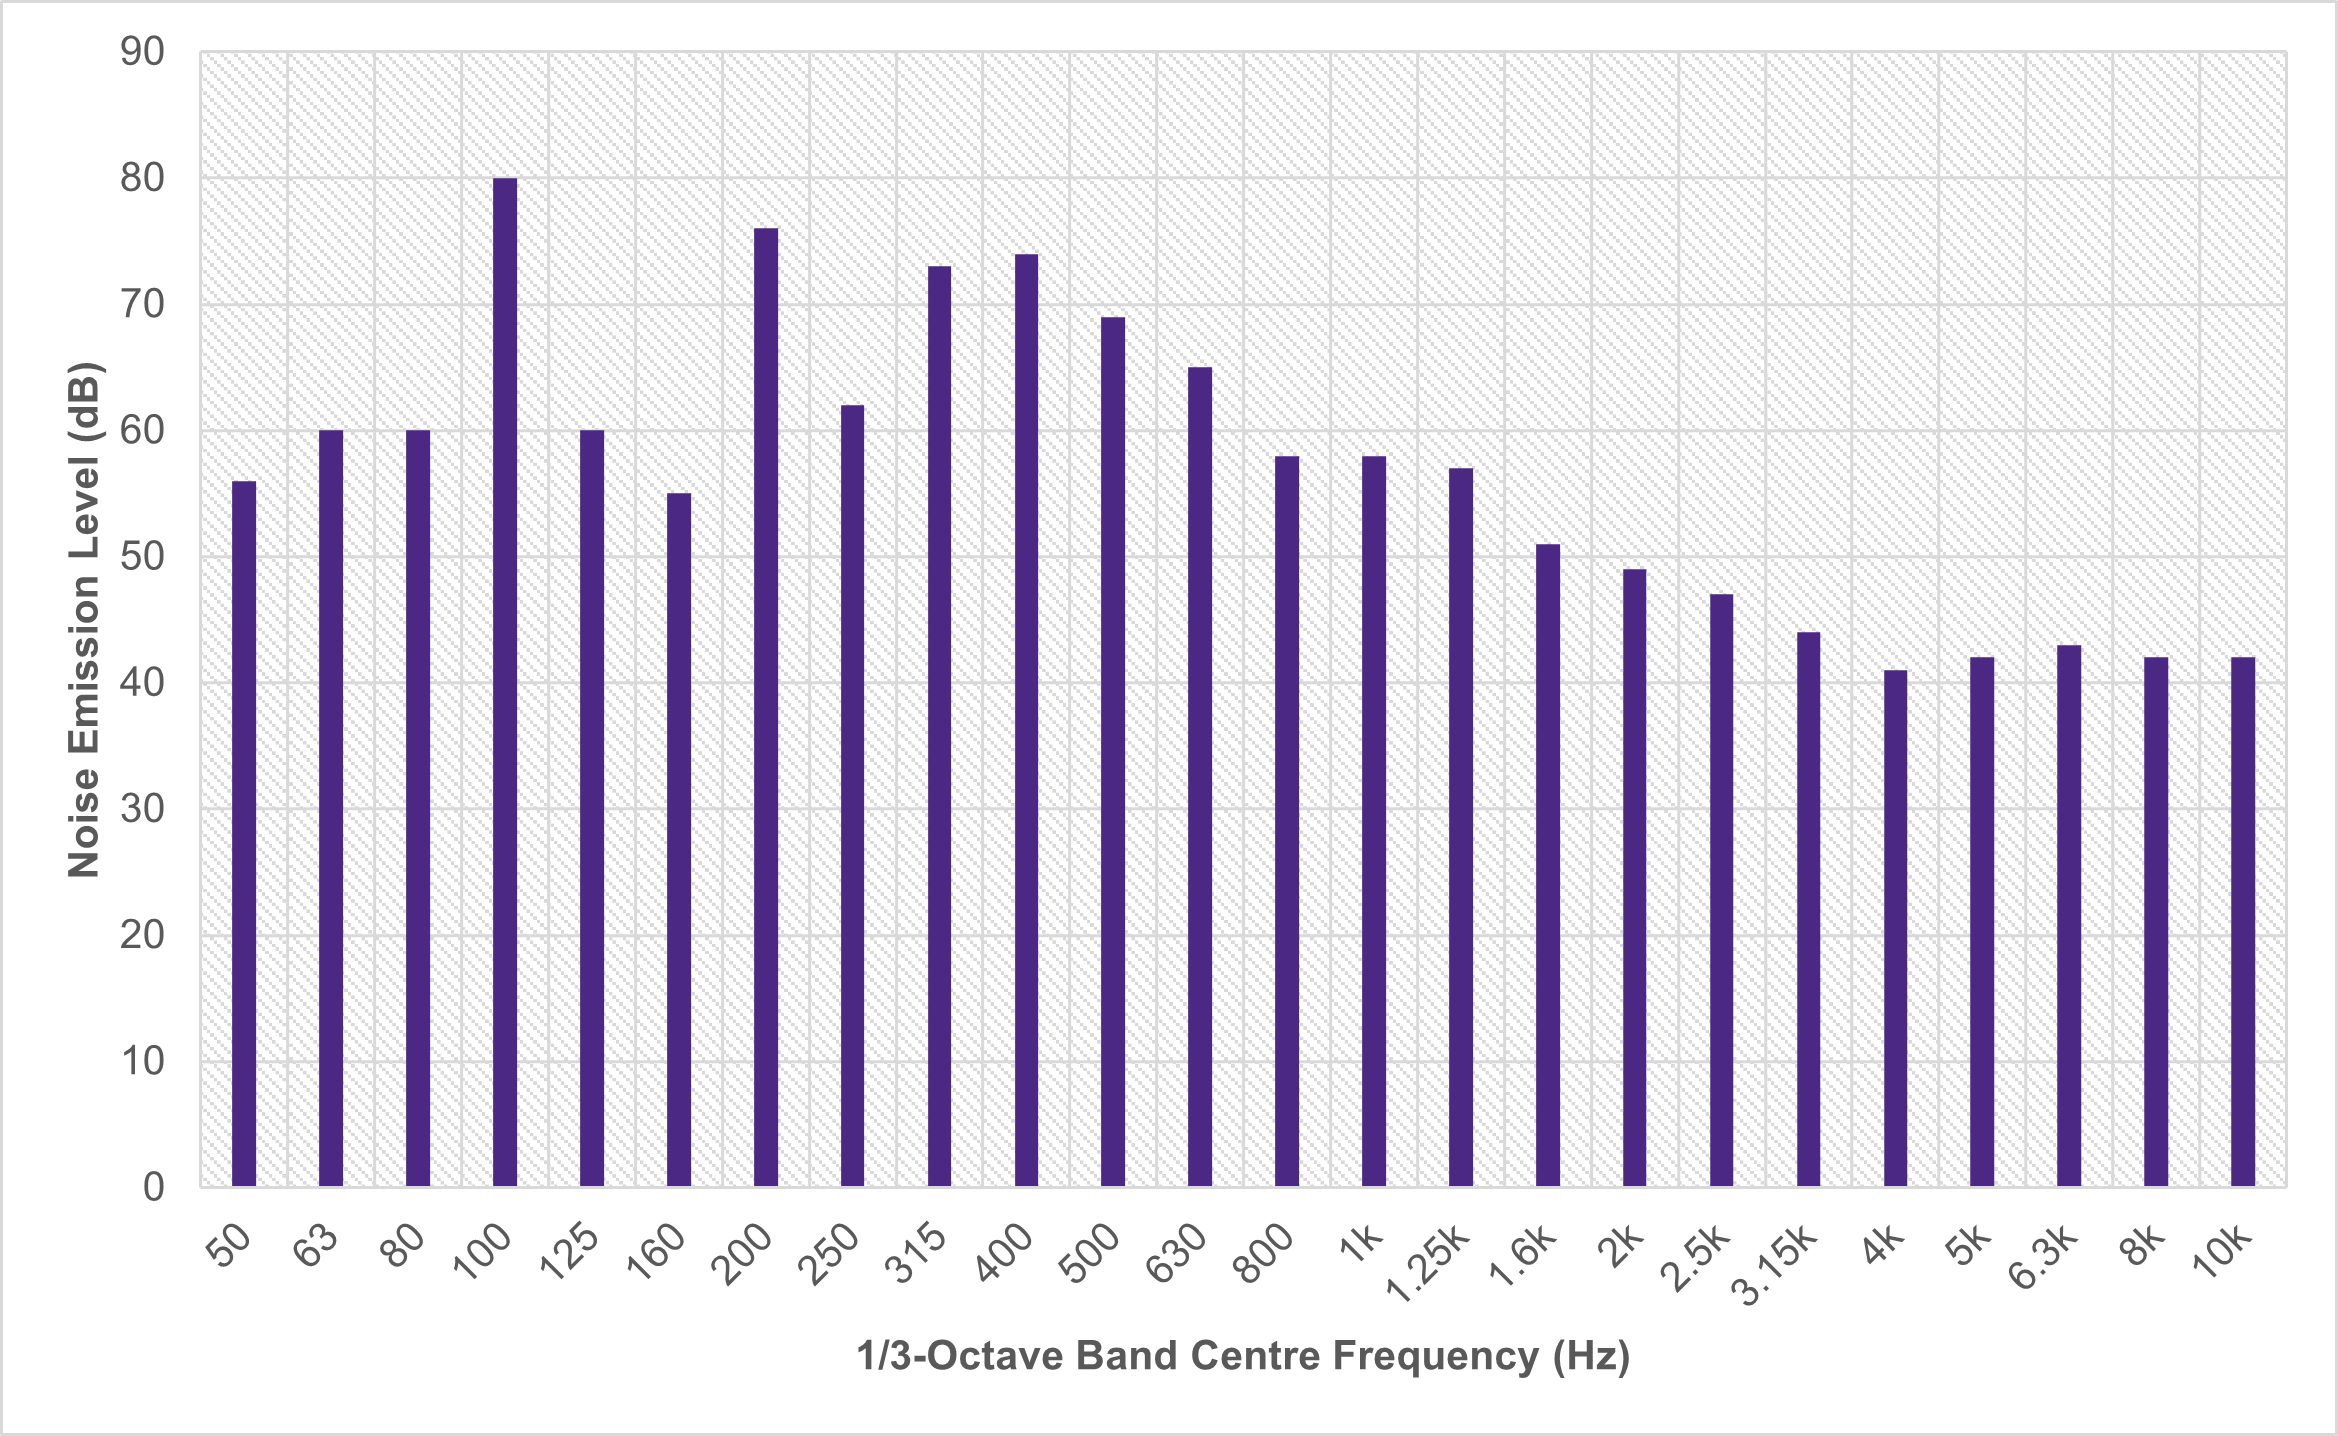
3.2.17 The frequency content for the Super Grid Transformer has been sourced from research into the tonal components at low frequency (Gange, 2011). This frequency spectrum has been applied to the broadband sound power levels in Table 3.4 Open ▸ and provides a robust representation of the noise emission spectrum for the Super Grid Transformers and Shunt Reactors. The fundamental frequency where the tonal components are generally present is the 100 Hz 1/3-octave frequency band, as shown in Graph 3.1 below which shows the shape of a typical transformer spectrum (Gange, 2011). Subsequent harmonics to the fundamental frequency can be seen at higher frequencies. However, low frequency sound energy travels further due to the long wavelengths associated with the 100 Hz frequency band in comparison to the air through which the energy is transferred. As such, it is the low frequency sound rather than the higher frequency harmonics which requires most consideration.
Graph 3.1: Typical High Voltage Transformer Noise Emission Spectrum
3.2.18 As such, where these plant items are most influential to the overall receptor noise level, a correction of +2 dB, +4 dB, or +6 dB has been applied corresponding to ‘just perceptible’, ‘clearly perceptible’, and ‘highly perceptible’, respectively, in terms of BS 4142:2014+A1:2019.
3.2.19 At this stage, the design of the Substation is indicative and not finalised. During the detailed design phase, mitigation measures will be considered and adopted to aid in the reduction of noise from the Substation plant at nearby receptors to meet the required noise limits.
3.2.20 The plant layout will be designed to reduce noise impacts as much as is reasonably practicable and additional mitigation measures such as acoustic enclosures, attenuators, and acoustic barriers may be implemented as part of the Proposed Development. The exact measures will be determined as the design progresses. In this assessment consideration has been given to the limiting plant noise emission levels and the type of mitigation measures which may allow for these levels to be achieved for the purposes of demonstrating the development can meet limits and therefore it would be appropriate for PPP to be granted.
3.2.21 Acoustic enclosures are available which attenuate sound at 100 Hz by around 20 dB (National Grid, 2021). An enclosure which can achieve this amount of low frequency attenuation will reduce noise levels at higher frequencies by a greater amount. However, an overall noise reduction of 20 dB has been applied as a conservative assumption in the absence of a full enclosure specification.
3.2.22 It is noted that, during the detailed design phase, consideration should be given to sympathetic 100 Hz resonance from the panels of any enclosures deployed.
3.2.23 In the absence of a detailed design, indicative mitigation measures which may be incorporated as a primary mitigation measure (as part of the design) have been included within the assessment. The losses for each measure and where they have been applied are presented in Table 3.5 Open ▸ below.
Noise sensitive receptors
3.2.24 The nearest residential noise sensitive receptors to the Substation Switchyard are presented graphically in Figure 1.1. The relative distances of each receptor to the permanent Substation Switchyard are presented in Table 3.1. These distances have been calculated using geographical information software and correspond to the distance of the OS AddressBase data point to the Substation Switchyard boundary.
Operational Noise Limits
3.2.26 Where background noise levels are particularly low, i.e. 30 dB LA90,15 min or lower, THC Environmental Health Department have confirmed that “it is unlikely that a level of 30dB [LAeq,15 min] would constitute a nuisance and also complies with current guidance and Standards” and will not, therefore, constitute a significant effect.
3.2.27 Background noise levels at the closest receptors to the Substation are characterised by measurement data collected at long-term baseline noise survey locations LT10 (for receptors to the south and west) and LT11 (for receptors to the north and east – see ) during the baseline survey, as reported in Volume 2, Appendix 13.1: Baseline Sound Survey, and replicated in Table 3.6 Open ▸ .
3.2.28 Since the proposed mode of operation of the Substation is continuous, the night-time level will be the limiting factor. It is evident from Table 3.6 Open ▸ that the measured night-time background sound level at the closest NSRs is no more than 19 dB(A). The operational noise limit of 30 dB LAeq,15 min, agreed through consultation with THC Environmental Health, is therefore appropriate for these NSRs.
3.2.29 Based on the above, the operational noise limits in Table 3.7 Open ▸ are proposed to control operational noise impacts at the nearest noise-sensitive receptors.
3.3Operational Noise Model Output and Assessment
Baseline Scenario
3.3.1 The results of the baseline (unmitigated) scenario for the operation of the Substation are presented in Table 3.8 Open ▸ with a colour contour plot presented in Annex B. No acoustic character correction has been applied to the LAeq results.
3.3.2 The 100 Hz third-octave band results are presented without the ‘A’ frequency weighting applied.
Mitigated Scenario
3.3.3 The predicted noise levels at receptors, with mitigation included based on the required noise reductions outlined in Table 3.5 Open ▸ , are presented in Table 3.9 Open ▸ with a colour contour plot presented in Table 3.9 Open ▸ .
3.3.4 Table 3.10 Open ▸ and Table 3.11 Open ▸ below present the baseline and mitigated assessments of the operational noise from the Substation.
3.3.5 An acoustic character correction of +4 dB has been applied to the unmitigated rating levels in recognition of the 100 Hz content of the transformers audible at the receptors, which would be described as ‘clearly tonal’.
3.3.6 No such acoustic character correction is appropriate for the mitigated assessment due to the level of the 100 Hz third-octave level at the receptors being reduced to no higher than 30 dB.
3.3.7 The results shown in Table 3.10 Open ▸ for the unmitigated scenario identify a number of medium and high impacts during the daytime period and high impacts at all receptors during the night-time period when background sound levels are lower and have the potential to result in significant adverse effects, depending on context.
3.3.8 It should be noted that the sound power levels used as noise model inputs are in the upper range for the type of plant assessed and, as outlined in Table 3.5 Open ▸ , mitigation measures have been proposed to assess the levels required to avoid significant adverse effects.
3.3.9 Table 3.11 Open ▸ shows that, with mitigation measures in place, the highest magnitude impact at receptors is negligible during the daytime and medium at night, depending on context.
Context
3.3.10 The context in this case is that both the rating level and the 100 Hz third-octave level at all receptors, as presented in Table 3.9 Open ▸ , are compliant with the relevant operational limit from Table 3.7 Open ▸ , and operational noise is therefore objectively very quiet with no discernible tonality.
3.3.11 In qualitative terms, with reference to Table 3.3 Open ▸ , worst case would be classed as ‘Just Noticeable (Non-Intrusive)’ and therefore the magnitude impact at all receptors is negligible.